 NasdaqTerminal
Live market terminal · Nasdaq & tech
Everything that moves the Nasdaq, on one screen.
Fed odds, bond yields, liquidity, options positioning, borrow fees and key levels, side by side and refreshed every minute. Every view comes with a plain-English guide to reading it.
The problem
Trading the Nasdaq means watching ten screens at once.
Each one lives on a different site, in a different format, on a different clock. NasdaqTerminal puts them side by side, reads them on one scale and refreshes every minute.
What is inside
Fifteen views, one terminal
Open one view at a time from the menu, or scroll the Overview page that stacks them all.
Rates and macro
- FedHold, hike and cut odds for each coming meeting and the path to year-end
- Bonds2Y, 5Y, 10Y and 30Y yields, today's change and the one driving the Nasdaq
- InflationThe Cleveland Fed daily inflation nowcast against consensus
- PolymarketCrowd odds for Fed meetings and inflation prints
- MacroEleven futures markets combined into one score for the Nasdaq
Market pulse
- BarometersFour gauges on one bar from −100 to +100, plus a composite
- Buy / SellBottom and top scores from 0 to 100, with the conditions behind them
- LiquidityTreasury cash, funding stress, bond volatility and credit
- RotationWhether money is flowing into tech or out to value
- VolumeStocks trading at a multiple of their normal volume
Positioning
- StarsBuy and sell setups at anchored price levels, graded one to five stars
- LevelsWhere option walls line up with key prices, plus double bottoms and tops
- BorrowBorrow fee and shares left to lend, for the watchlist and a wide list
- GEXOption floor, ceiling and gamma regime for each stock and ETF
- Option WallsEighteen charts of option exposure by strike, with the wall lines
A quick tour
Real screens from the terminal
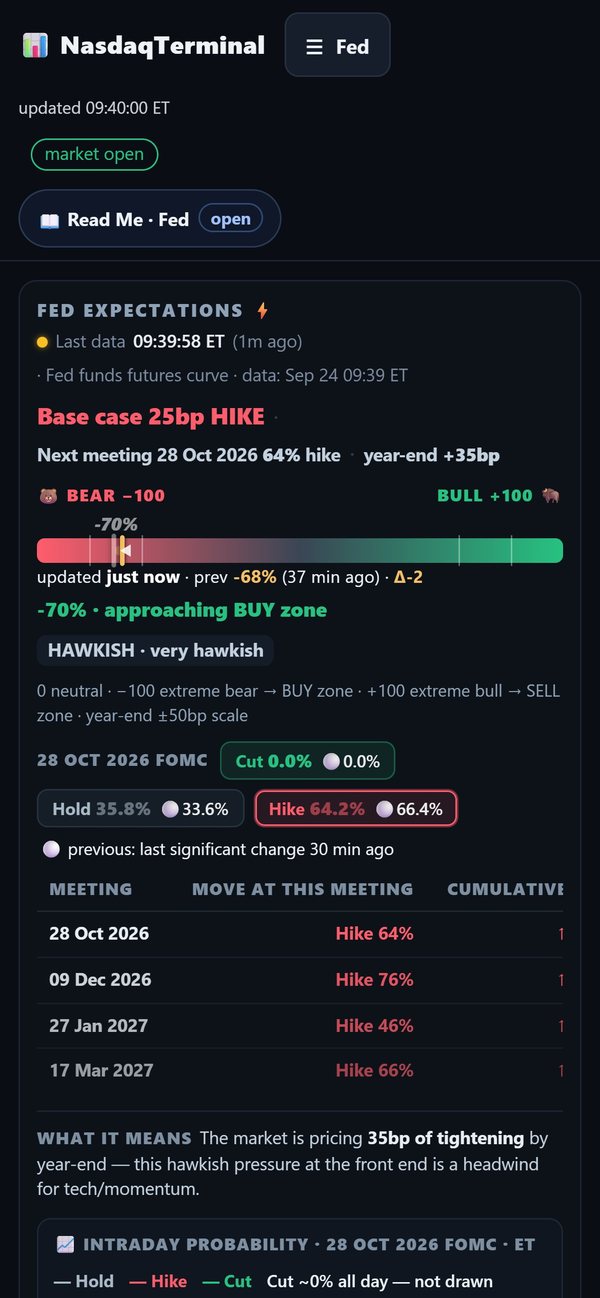
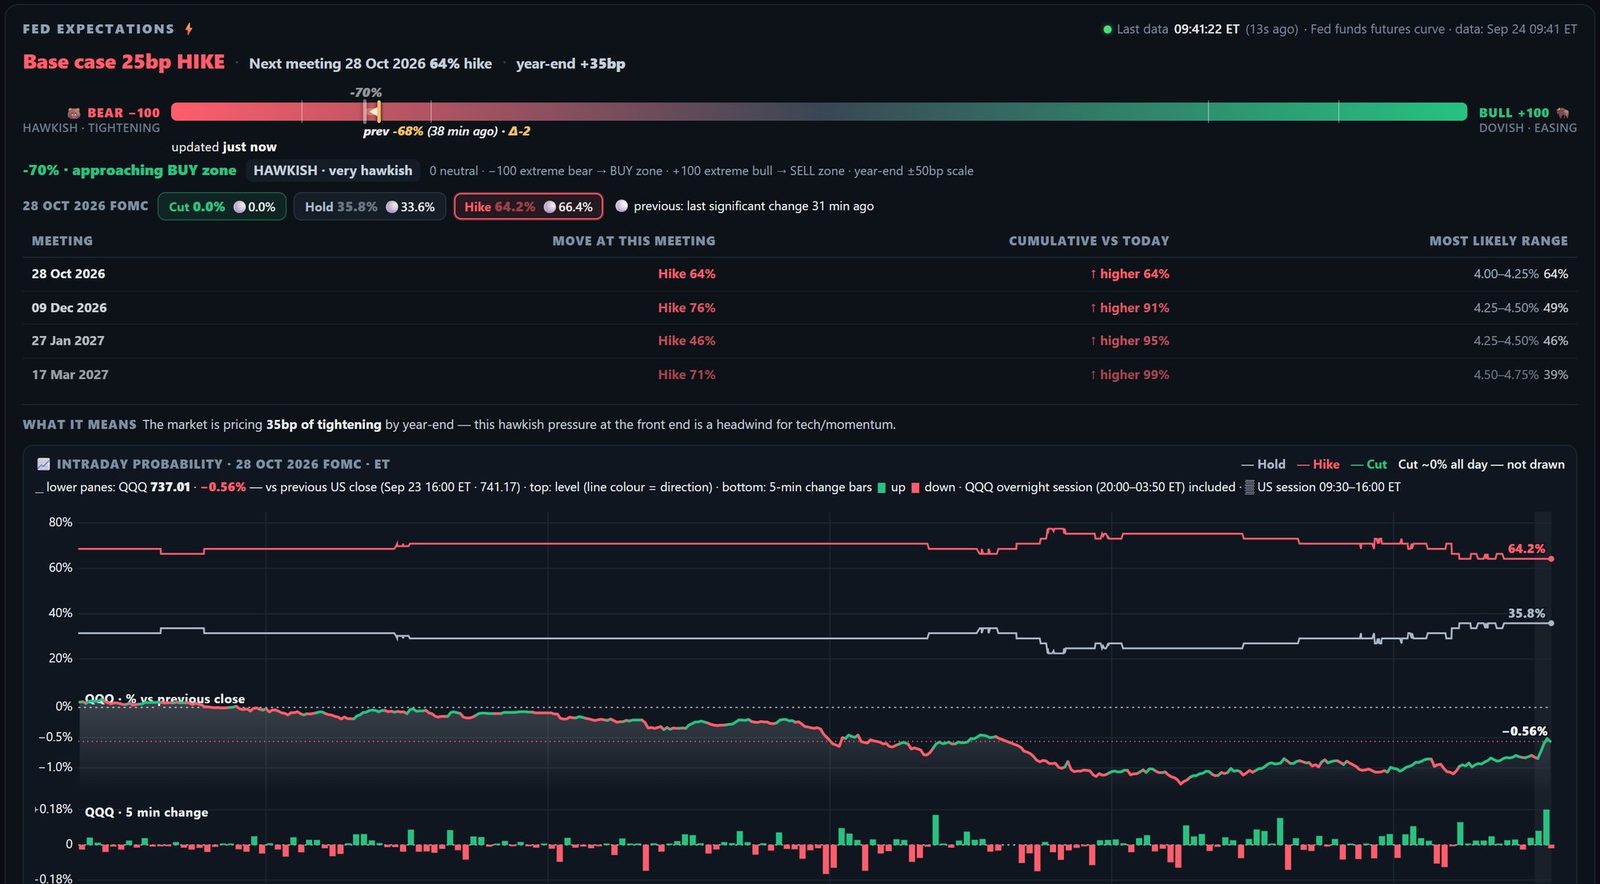
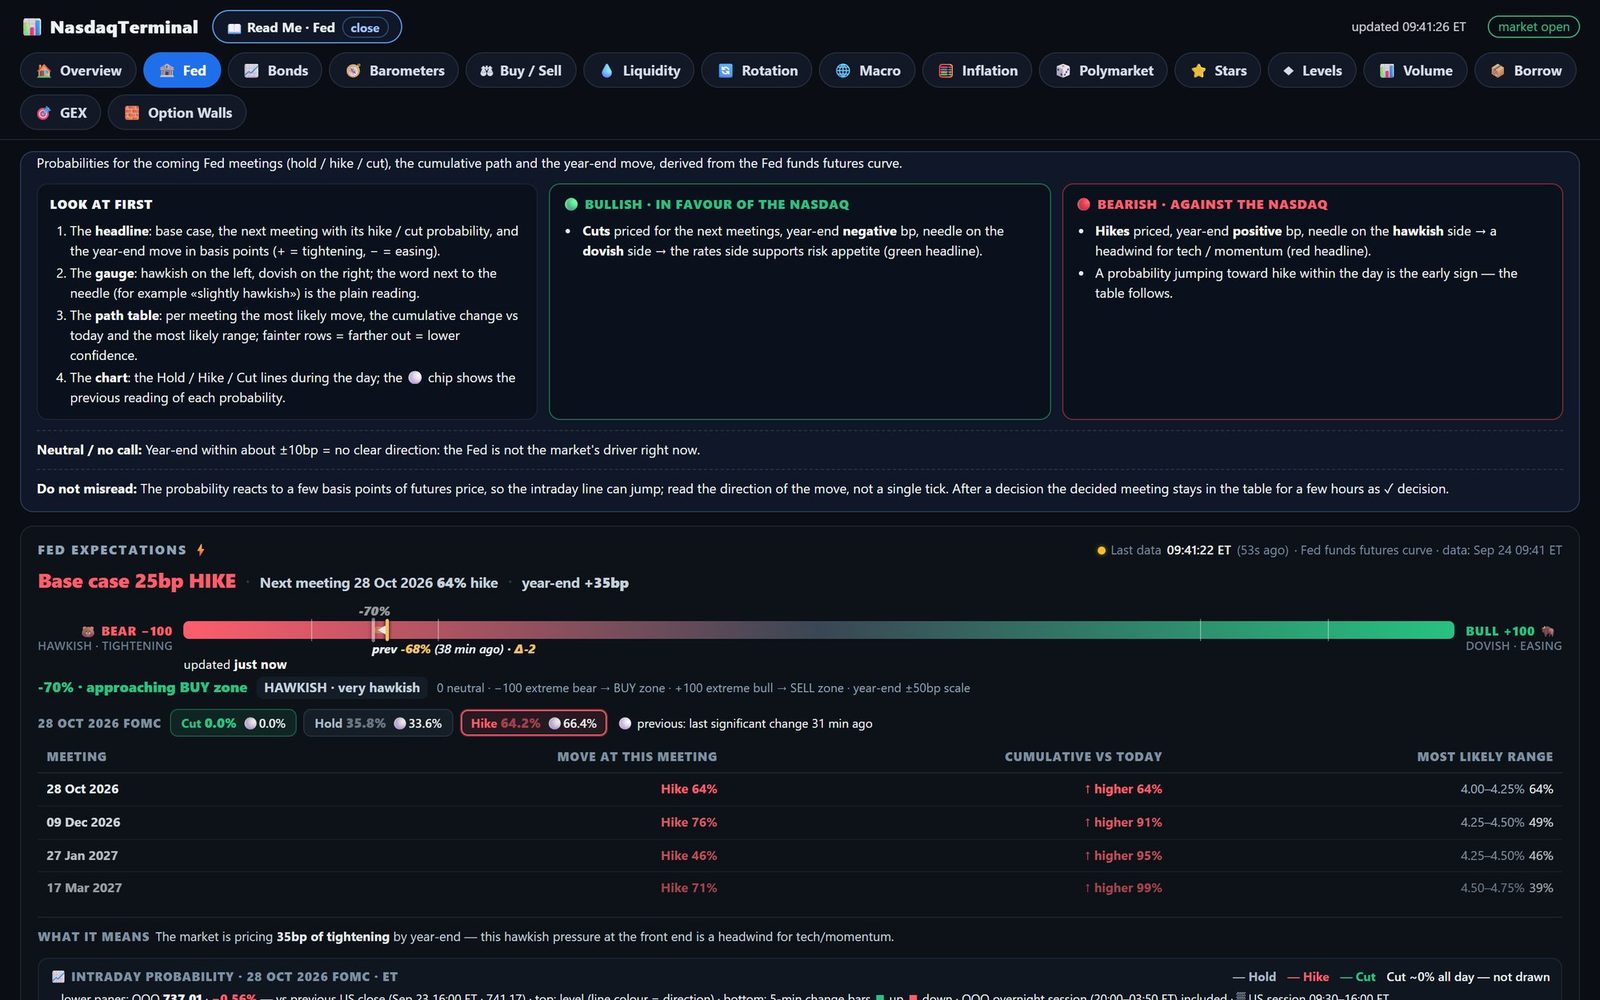
01 · Rates
What the Fed is expected to do, live
- Meeting by meeting: hold, hike and cut odds, and the path to year-end.
- One needle from hawkish to dovish, with a plain-English line on what it means for tech.
- Against the index: the odds charted through the day next to the Nasdaq-100 (QQQ).
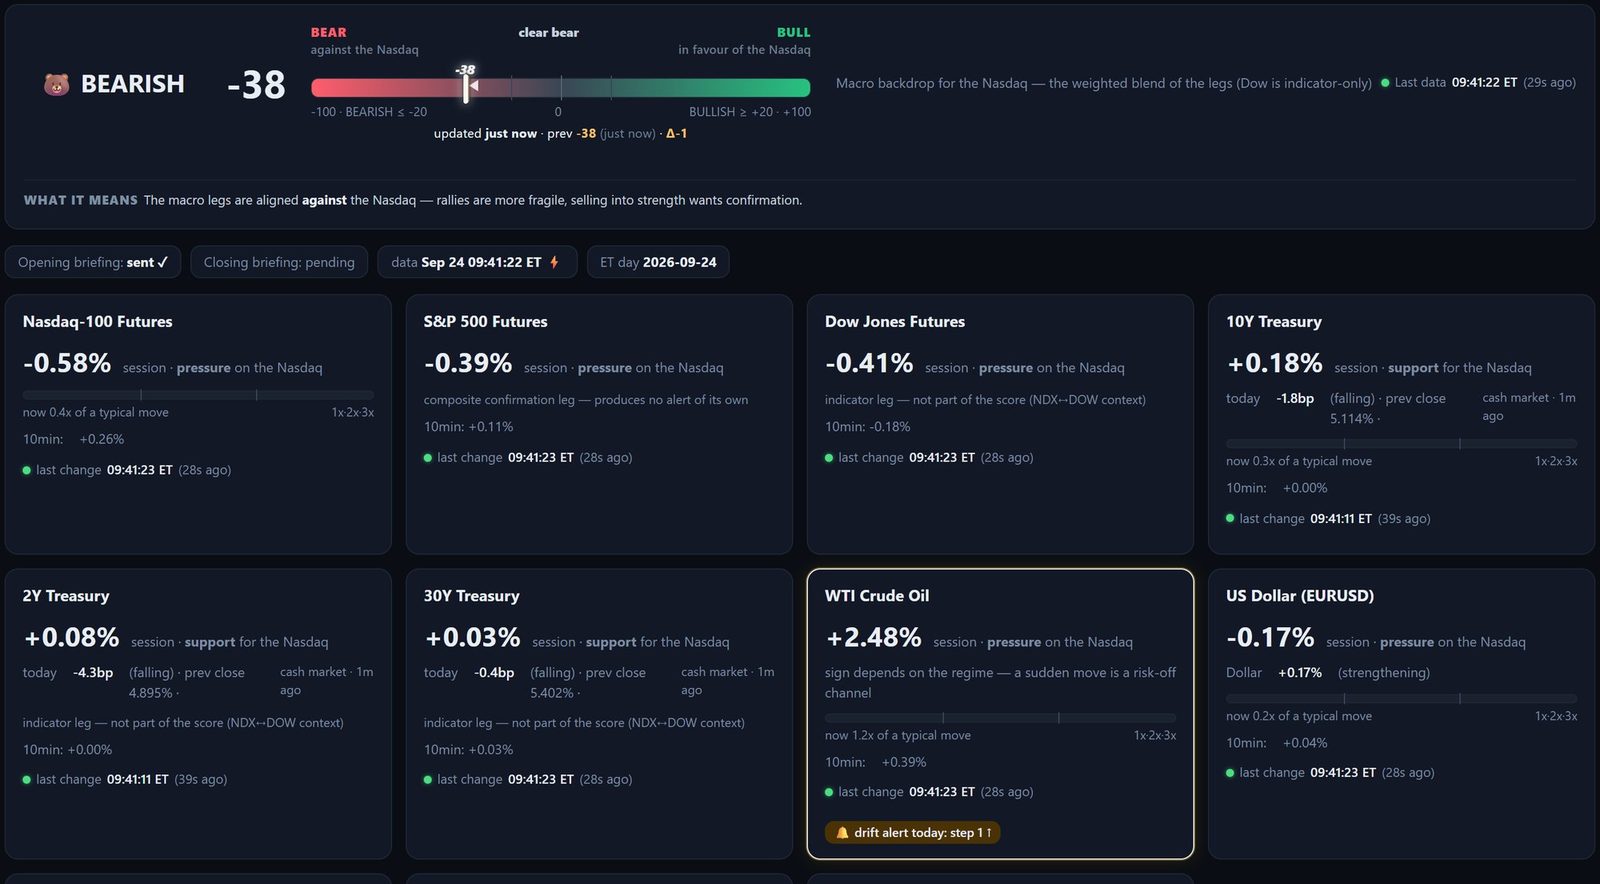
02 · Macro
Eleven markets, one score for the Nasdaq
- Every leg labelled: index futures, Treasuries, oil, the dollar and more, each marked as support or pressure.
- One number from −100 to +100 that sums them up.
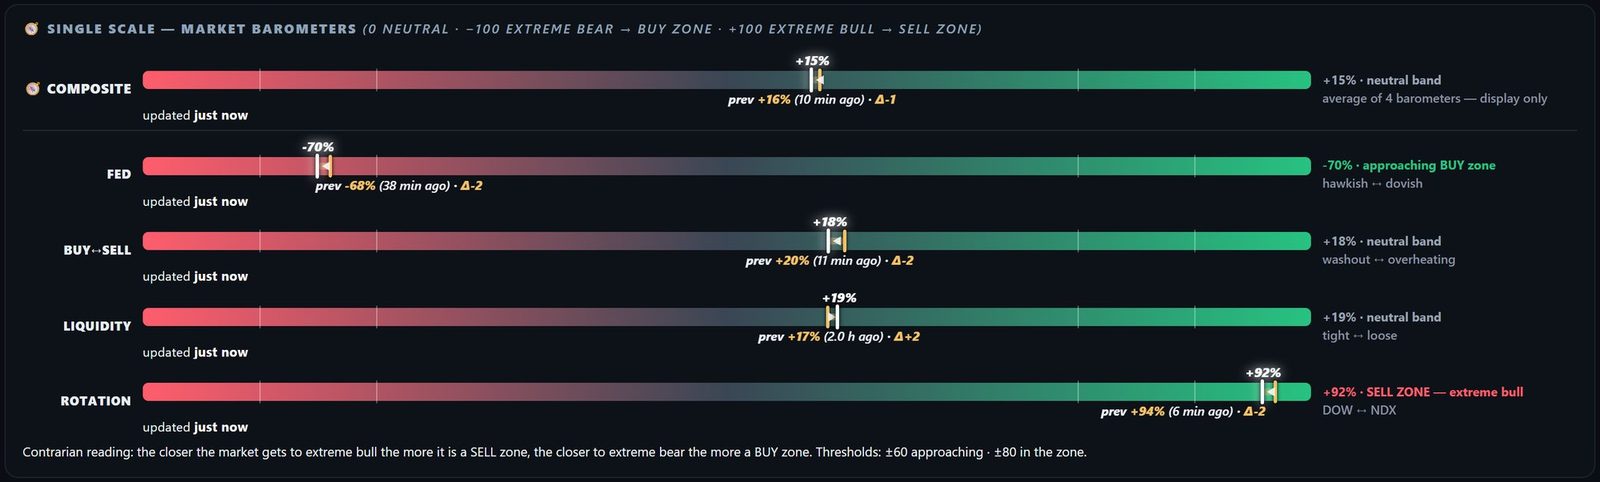
03 · Pulse
Every gauge on the same scale
- One bar for Fed, Buy / Sell, Liquidity and Rotation, plus a composite.
- 0 is neutral. A marker shows where each reading stood a few minutes ago.
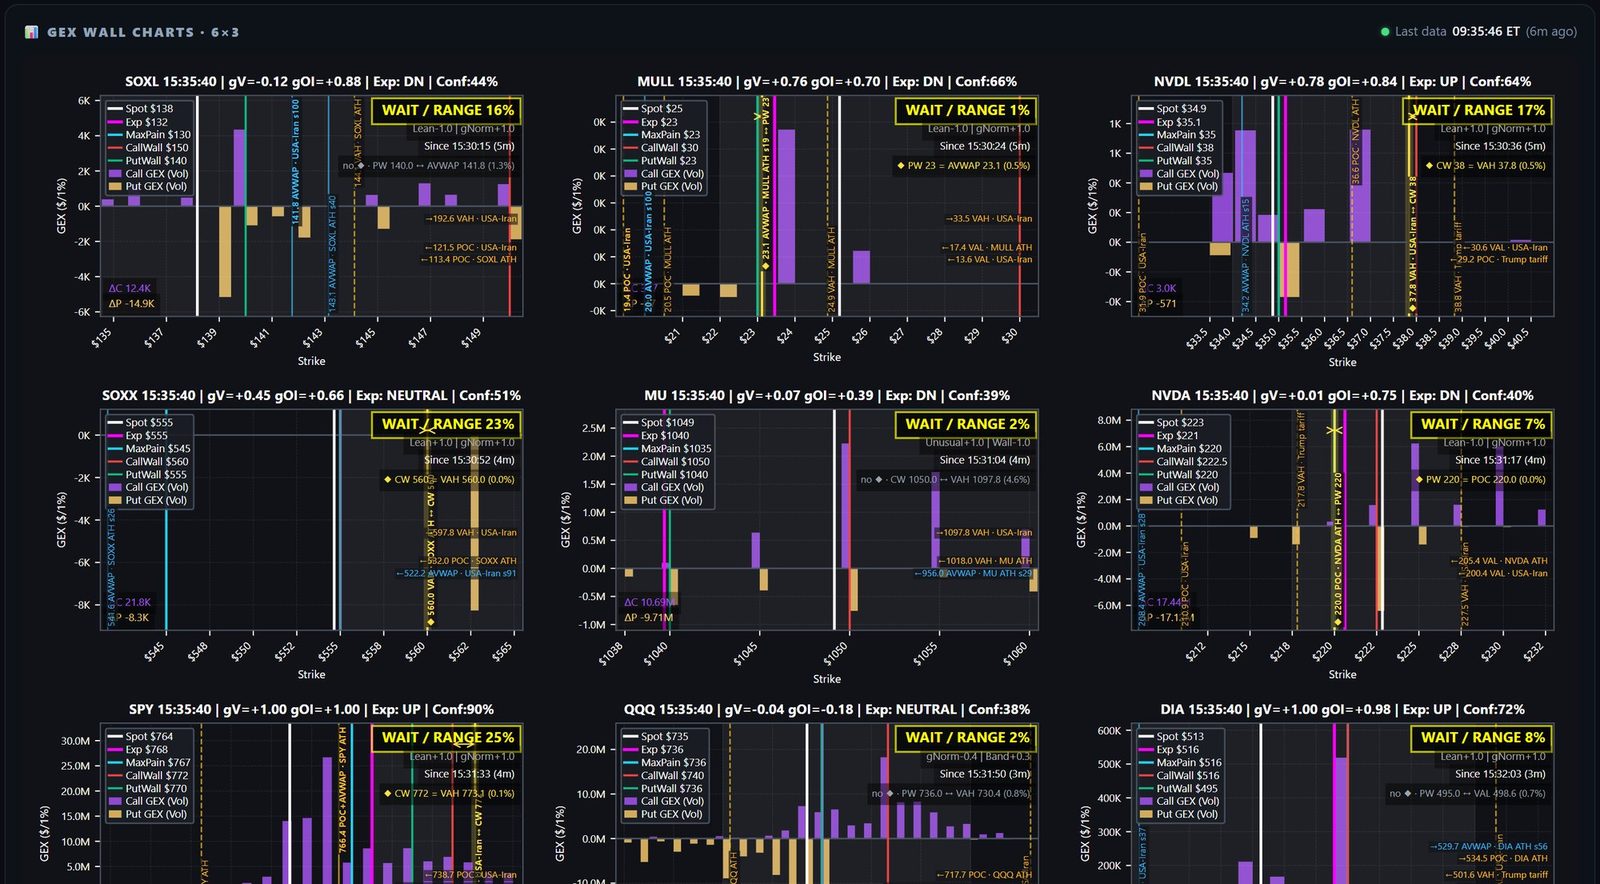
04 · Options
Floors and ceilings from options positioning
- Biggest put wall below (the floor) and call wall above (the ceiling) for each symbol on the watchlist.
- Gamma regime shown next to the walls: positive, flat or negative.
- Eighteen wall charts of exposure by strike, with key price levels drawn in.
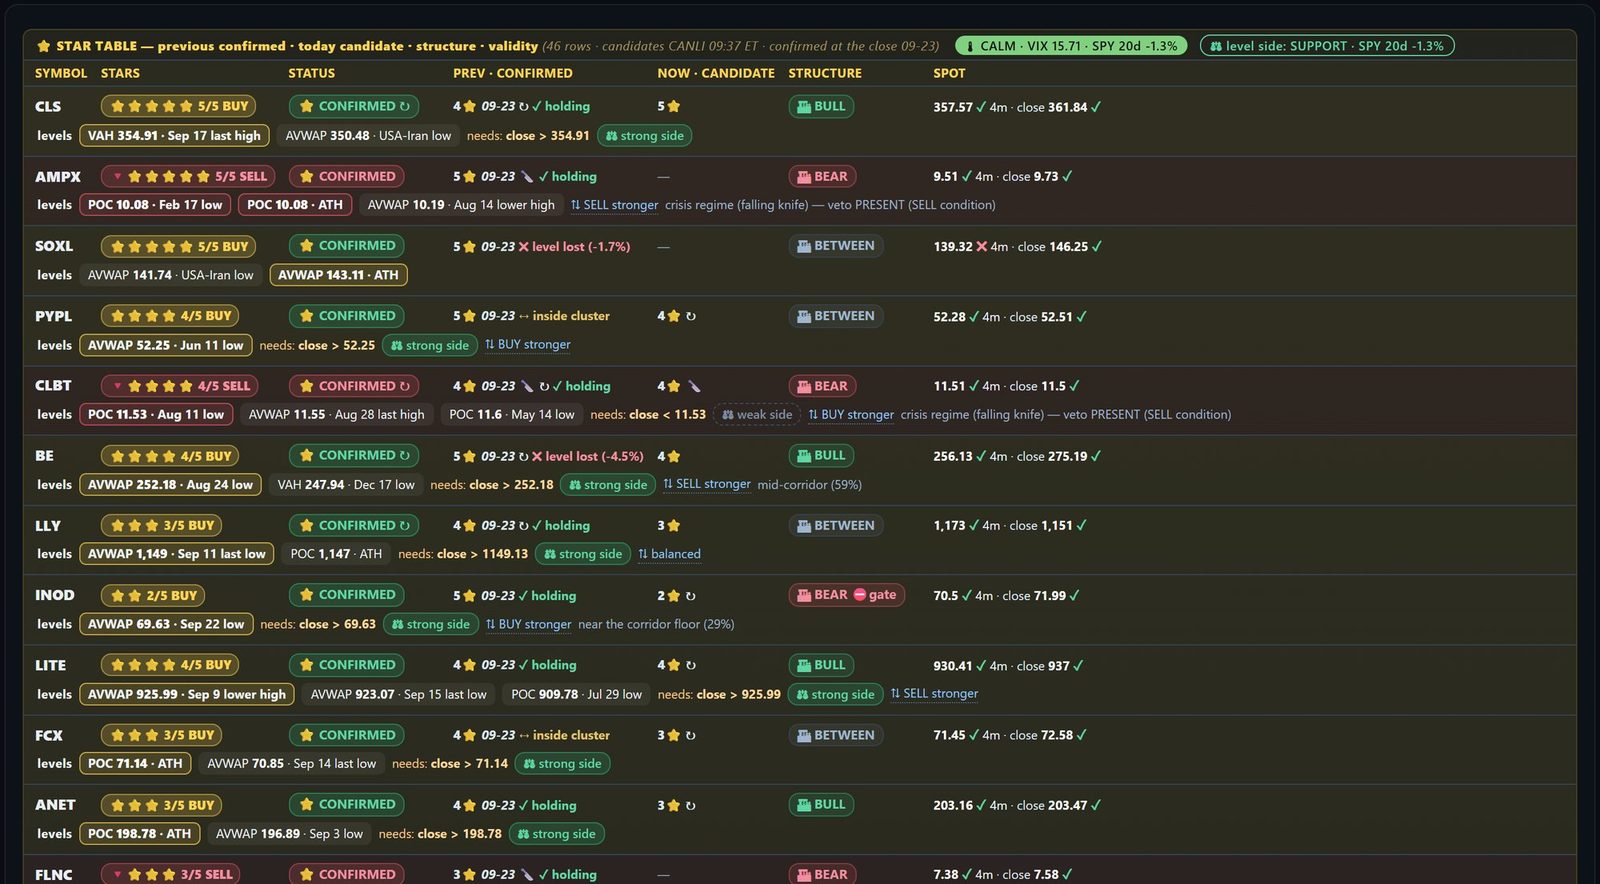
05 · Setups
Graded setups at key price levels
- Stars grade buy and sell setups from one to five.
- Still valid? Live price and last close, each marked inside or outside the setup's condition.
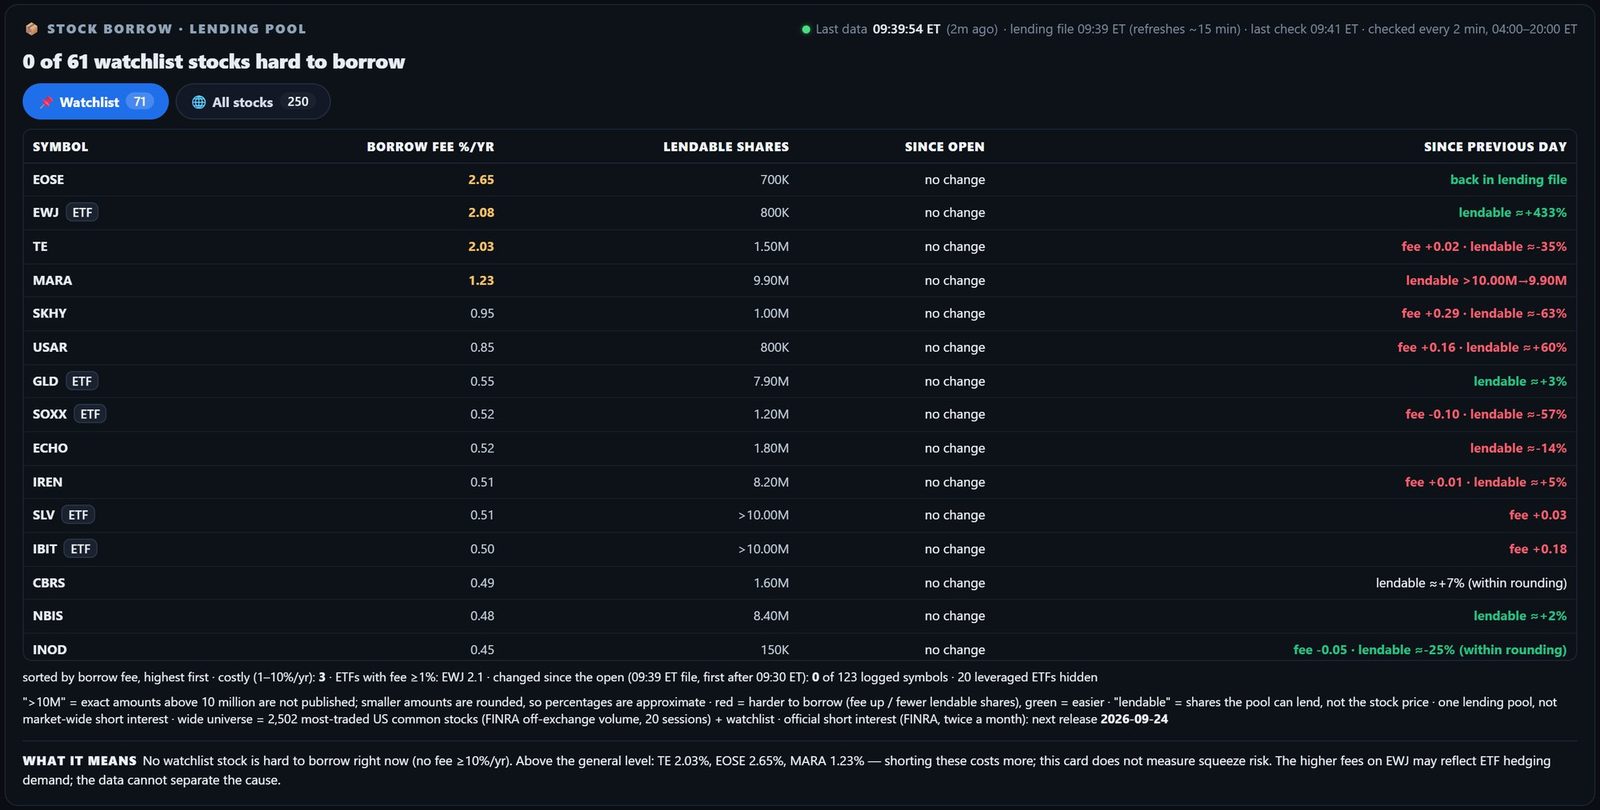
06 · Borrow
What it costs to short
- Borrow fee and lendable shares for the watchlist and a wide list of US stocks.
- A rising fee and a shrinking pool mean short sellers are crowding in.
07 · Read Me
Every view explains itself
- One click on Read Me opens the guide for the view you are on.
- What it shows, where to look first, what reads bullish or bearish, and what not to misread.
Access
Private access that stays current
Email sign-in
A one-time code arrives in your inbox. There is no password to remember.
Desktop and phone
On a small screen every view folds into one column.
Every 60 seconds
Each module carries a freshness stamp, and a red strip warns you if the feed stops.
US Eastern time
A session strip shows pre-market, open or closed.
Membership
Paid membership, limited seats
What members get
- All fifteen views and the Overview page
- Updates every minute during the trading day
- Read Me guides on every view
- Private login by email code, on desktop and phone
Pricing on request
Seats are limited so access stays personal. Ask for details or a demo account and we reply by email.
Request info or a demoAlready a member? Log in
Request access
Ask for details or a demo account
Tell us a little about yourself and we will reply by email.
- Send the form. It takes under a minute.
- We reply by email with membership details, or with your demo access.
- Sign in with that email. Only addresses on our member list can open the terminal.
Thank you, we have your request
We will reply by email. If you asked for a demo, the email explains how to sign in.
Privacy note
We keep the details you send (name, profession, investor or trader, what you asked for and your email) only to answer your request and, if you ask for one, to set up your demo account. We also store the country the request came from and a one-way code derived from your connection, used only to stop spam; it cannot be turned back into your IP address. We do not sell or share your details. To see or delete them, reply to any email from us.
FAQ
Questions
What is NasdaqTerminal?
A live web dashboard that puts the data behind Nasdaq and big-tech moves on one screen: rates, bonds, liquidity, macro futures, options positioning, borrow fees, volume and key price levels.
Who is it for?
Traders and investors who follow the Nasdaq and large tech stocks and want the backdrop in one place instead of across many sites.
Is this investment advice?
No. NasdaqTerminal shows market data and rule-based readings for information and education. It does not tell you what to buy or sell, and past readings do not predict future results.
How do I get access?
Send the request form above. We reply by email; once your membership or demo is approved, your email address is added to the member list and you can sign in. Only addresses on that list can open the terminal.
How do I log in?
Enter the email address on your membership. A one-time code arrives in your inbox; type it in and you are in. There is no password.
How often does the data update?
The page refreshes every 60 seconds. Every module shows how old its data is, and a red strip appears at the top if the feed stops.
What do I see when the market is closed?
Views that depend on the live session show the last session's view and say so clearly. Rates and macro views keep updating for as long as their markets trade.
Does it work on my phone?
Yes. On a small screen each view becomes a single column.